An XLSX content command that brings the contents of a Report Data value into its host Name's area.
Area size
The reportTable command expects its host Name's area to cover a certain amount of rows corresponding to the kind of report the Report Data value describes. The rows within the area are used as models for producing the different grouping and detail rows, meaning that all the cells in the record detail rows, for example, will be exact copies of the cells in the detail row model in all but the dynamic content in them.
Regardless of the report, the area's topmost row is treated as a header row and is not modified by the command in any way, and the bottom row is the grand totals row. In addition to these two rows, the area needs a different amount of rows depending on the type of the report and if detail rows are shown or not:
-
If the report is of the Summary format, the table should have one model row for every level of grouping in the report. The first row of the table is for the highest grouping level. There may be one to three groupings, so as many possible rows. These rows are the ones directly below the header row.
IfshowDetailsis undefined or resolves intotrue, one additional model row for the record details is needed. This row is to follow the grouping rows. -
If the report is of the Tabular format, there is no need for grouping rows.
IfshowDetailsis undefined or resolves intotrue, one row is needed between the header and the grand totals rows as the model row for the record details.
If the amount of rows is not correct, an error telling the expected number will appear upon evaluation.
Displaying the report data
During the production of the all the grouping and detail rows, variables containing specific parts of the Report data corresponding to the currently processed row can be accessed. These variables are described below.
In each of the grouping rows, a variable containing a Report Data - Group Container value of that grouping level may be accessed. The name of that variable is either gr1, gr2 or gr3, the first being for the highest grouping level and the last for the lowest level. So, to display the label and value of the highest grouping, for example, use expressions like ${gr1.label} and ${gr1.preformatted} or ${gr1.value} in cells of that grouping's model row.
In each of the detail rows, a variable containing a Map of the column values as Report Data - Value Container values may be accessed. The name of that variable is det and the keys are labels and Report API names of the fields. The labels are the column labels you can see in Salesforce's rendition of the reports, such as "Opportunity Name" and "Probability (%)", but do note that these are localized and therefore vary between users of different languages. Use expressions like ${det['AMOUNT'].value} and ${det['PROBABILITY'].preformatted} in the detail row model's cells to display the detail values.
In the row for grand totals, a variable containing the Report Data - Group Container value for the grand totals may be accessed with the variable name tot. This value only contains the label and aggregates data entries. For example, an expression like ${tot.label} (${tot.aggregates['RowCount']} records) could resolve into "Grand Totals (196 records)".
Syntax:
reportTable(value,showDetails)
With required attributes only:
reportTable(value)
Attributes
|
value |
|
|
|---|---|---|
|
Required |
Value type |
EL-evaluated |
|
Yes |
Report Data |
Yes |
|
Defines the data whose contents this command is processing. |
||
|
showDetails |
|
|
|---|---|---|
|
Required |
Value type |
EL-evaluated |
|
No |
Boolean |
Yes |
|
Defines if the detail rows of the report will be displayed. If this attribute's value resolves into If undefined, the value of |
||
Examples
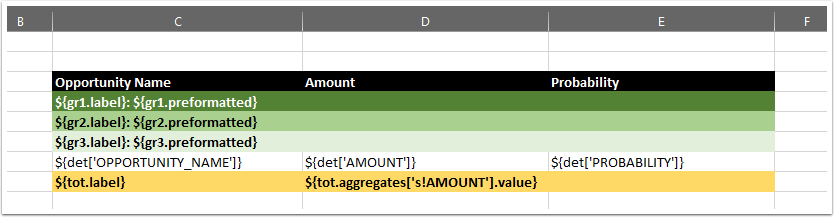
The reportTable command itself is easy to set up, as just providing it a variable holding a Report Data value is enough. The possible questions are more likely to appear with coming up with the expressions needed to display the data. Here is an example that is for a Summary report of Opportunity records with three grouping levels and the columns Opportunity Name, Amount and Probability, with both details and grand totals included. The area here therefore requires six rows: one for the header (the black row), three for the groupings (the rows of varying shades of green), one for details (the white row) and one for grand totals (the yellow row).