If problems arise during the creation of a template's logic, the Debug view may prove helpful. It provides two different types of data related to the template's evaluation process that can assist in understanding why certain parts of the logic are not functioning as expected.
As the Debug view is part of the Dynamo template composing UI, none of the features specified here work as intended if a template is composed through the API since there's no UI to display the generated debug data.
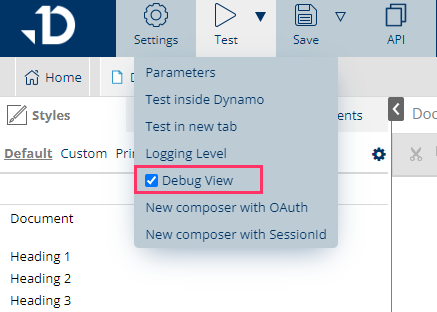
Debug view can be enabled from within the Template Builder under the Test menu.
The Debug View will appear once the document generation process is completed and the exit button is clicked.
Variable context
An integral part of template evaluation is the variable context, supplying commands with values for their attributes, and where commands store produced values. The subview displays all values and keys in the variable context at a specific template evaluation point, aiding in understanding expression issues or inspecting query results, such as Salesforce queries.
To show the Variable Context view, a Debug break is needed in the template's logic. This potential break, applicable to any command, is a universal attribute interpreting an EL-expression as a Boolean. If the result is "true," the break occurs post-evaluation. You can set it as "true" for a consistent break or use expressions for selective breaks, useful in loops. If the Debug break's expression evaluation fails, no break occurs.
A successful Debug break halts the logic Flow and shifts the UI to the Debug view.
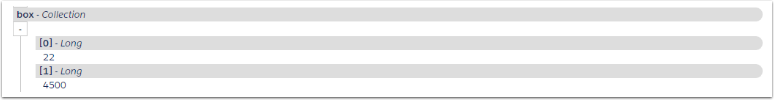
Each context variable displays its key and value type on lines with a gray background. Below, the variable's value is shown. For types with properties or nested values, like Map or Collection, clicking the '+' square opens and closes the value, revealing or hiding its contents. With most types, you'll see keys and values, but Collections display only indexes. Empty Maps and Collections show "empty" in the value space with nothing to click.
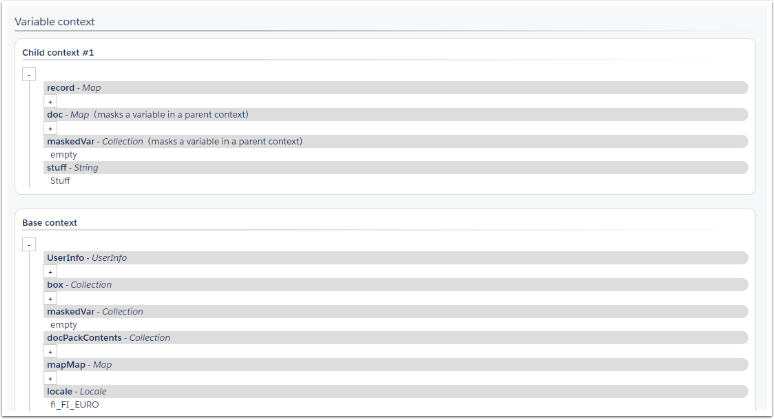
If a Debug break happens within a command creating a child context (e.g., forEach from the Loops library), the Variable Context view splits into the Base context and one or more Child contexts (as shown in the first image). In this scenario, you might observe a variable's type, accompanied by a notice indicating that the variable is masking a variable in a parent context. This signifies that the child context has a variable with the same name as one in another context, and commands in the child context can only access the child context's value for it—potentially leading to unexpected expression results. The child context section may also clarify why a variable appears to be missing later in the logic, as variables in that section disappear when the context-creating command concludes.
Logic trail
The Logic Trail, a subview in the Debug tool, showcases every command evaluation during the logic's execution. It allows you to delve into the details of each command's attributes, inspect the produced variables, and identify evaluations that failed due to errors. Additionally, it serves as a valuable tool for understanding the time spent on different aspects of the Flow by reporting the execution time for each command and Step.
To access the Logic Trail, the evaluation process must be directed to collect this data. This is achieved by specifying the request parameter "debugTrail" with the value "true". Alternatively, in the Template builder, you can enable the "Debug View" option found in the submenu of the Test button. When this parameter is active, any template runs as usual, and at the end of the evaluation, the Debug view reveals the Logic Trail, providing a comprehensive overview from start to finish. If a Debug break occurs during the evaluation, the Logic Trail appears alongside the Variable Context state in the Debug view, displaying the trail up to the break.
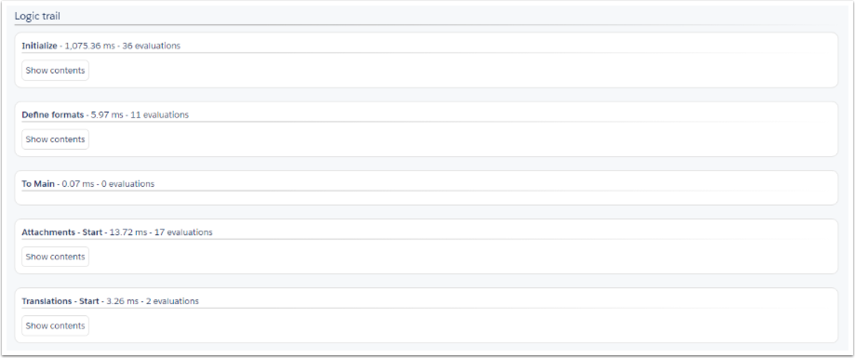
The Logic Trail provides an initial high-level view, presenting sections corresponding to the evaluated Steps in the Flow. Each Step section's header reveals the time taken for the Step's evaluation, the number of command evaluations within it, and any failed evaluations, if present. To access the command evaluations of a Step, simply click the "Show contents" button, revealing a detailed view as depicted below.
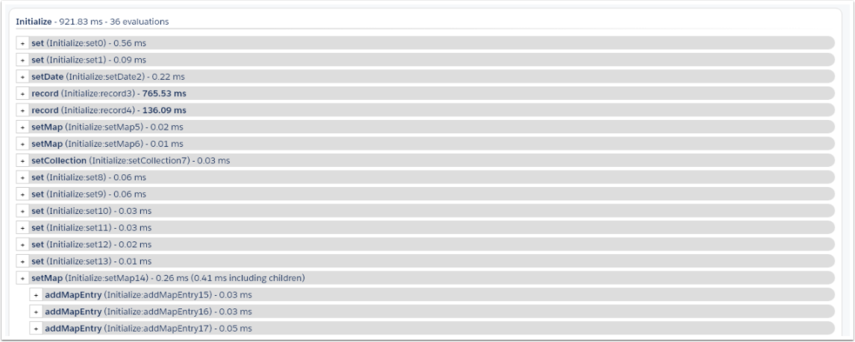
Each command's evaluation is presented on a gray line, including its name, system-generated ID, and the time taken in milliseconds. The ID helps identify the same command evaluation across different logic runs, generated based on the Step and the count of commands evaluated during that Step. This ensures consistency if the Flow structure remains unchanged.
Evaluation lines appear in order, with indentation for child commands. For parent commands, the line preceding indented ones reflects the parent's evaluation time, inclusive of all child commands.
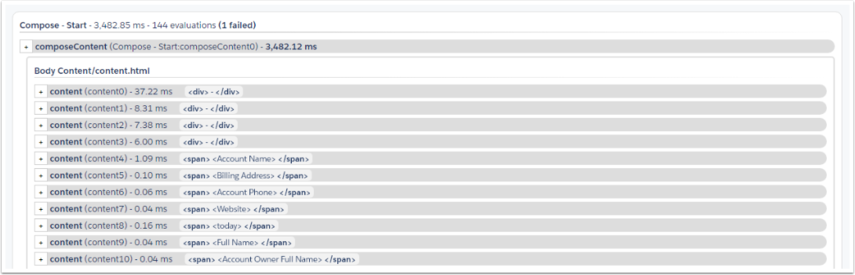
In Step sections, subsections may represent additional evaluation processes. For instance, the evaluation of an HTML document by a composeContent command has a title indicating its purpose, and the command above likely initiates the evaluation. The sequential number in each system-generated ID starts from zero within these processes, emphasizing their uniqueness within the main Flow evaluation.
To access more details about a specific evaluation, click the square on the left of its name to open the details view. If a line lacks this clickable square, there is no information to display in the details view, as some command evaluations are straightforward. The details view provides two types of information:
-
All attributes with defined values are shown. EL-resolved attributes display both the expression and the resulting value. If the resolved value belongs to a type with properties or contains other values, the value can be opened to reveal its contents.
-
If the command produces one or more variables, they are listed under the "Produced variable(s)" heading. Similar to other debug view values, you can inspect the variable's value.
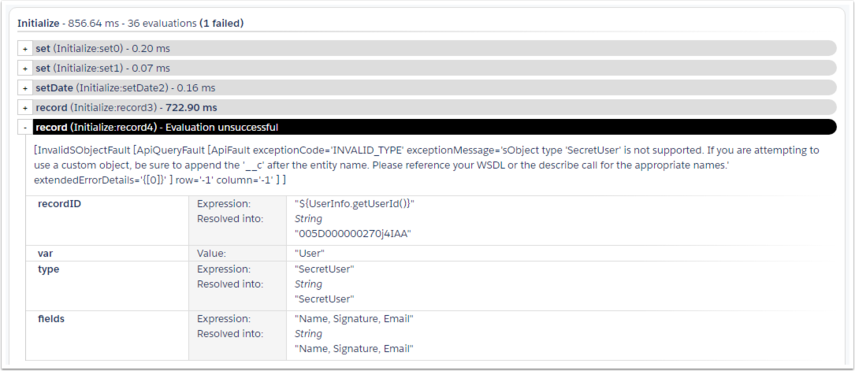
The Logic Trail offers a detailed perspective on command errors. For every command that failed to complete successfully due to an error, its line is darkened and tagged with "Evaluation unsuccessful." Expanding the details reveals the error message above the attribute values. In the example below, a Salesforce record command encounters an error while querying a record of an unknown object type. This leads Salesforce to return an error response, which the record command then forwards.
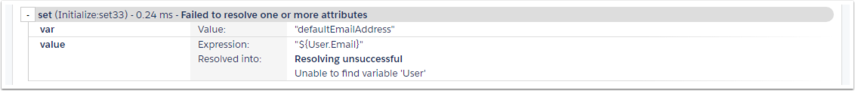
Evaluating EL-evaluated attributes within a command can result in an error. This may lead to the entire command's evaluation failure, or in some cases, the evaluation still concludes successfully to some extent. If a non-critical attribute evaluation error occurs, it is indicated on the command's line, and the details view provides information about the error in the "Resolved into" section related to the attribute. A common error, such as "Unable to find variable 'X'," occurs when the expression refers to a variable not set by preceding commands or isn't one of the automatically generated variables.