The Chart functionality requires additional licenses. Please contact support@documill.com to enable the licenses.
An HTML content command that draws a chart based on a Chart Data value.
In case the Chart Data doesn't contain all the needed information to render the chart, such as axis specifications, the chart-drawing process tries to fill in certain missing details so that the chart can be rendered. Here are some of them:
-
If no color has been specified for a series or a data point, a set of default colors is used to give each series or data point a different color.
-
If the chart type is such that is requires axes and the Chart data does not specify an X-axis (an axis with its position either being "top" or "bottom"), a default category axis is used that will appear at the bottom. If default category labels have been provided by the data point -creating commands, this axis will display those labels.
-
If the chart type is such that is requires axes and the Chart data does not specify an Y-axis (an axis with its position either being "left" or "right"), a default linear axis is used that will appear on the left. This axis has its minimum and maximum values derived from the data point values of the chart.
If the Chart Data contains contradictory or otherwise invalid specifications, the resulting chart will not be rendered properly.
Attributes
|
data |
|
|
|---|---|---|
|
Required |
Value type |
EL-evaluated |
|
Yes |
Chart Data |
Yes |
|
Defines the data based on which the chart is drawn. |
||
|
height |
|
|
|---|---|---|
|
Required |
Value type |
EL-evaluated |
|
No |
Number |
Yes |
|
Defines the height of the element displaying the chart in pixels. If this attribute is undefined, but |
||
|
width |
|
|
|---|---|---|
|
Required |
Value type |
EL-evaluated |
|
No |
Number |
Yes |
|
Defines the width of the element displaying the chart in pixels. If this attribute is undefined, but |
||
|
display-series-legend |
|
|
|---|---|---|
|
Required |
Value type |
EL-evaluated |
|
No |
Boolean |
Yes |
|
Defines if a legend displaying the labels of the series or data points in the chart is displayed. If the resolved value is false, the legend is not displayed. The legend takes space in the chart area, so hiding the legend allows the chart itself to have more of the space - this is particularly notable if the chart area is particularly small. If not defined, the legend is displayed. |
||
Examples
Logic
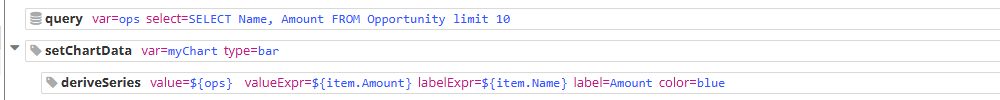
<query var="ops" select="SELECT Name, Amount FROM Opportunity limit 10">
<setChartData var="myChart" type="bar">
  <deriveSeries value="${ops}" valueExpr="${item.Amount}" labelExpr="${item.Name}" label="Amount" color="blue">
Template HTML
<dyn-chart data="myChart">Chart here</dyn-chart>