The Chart functionality requires additional licenses. Please contact support@documill.com to enable the licenses.
A child command of setChartData that adds a data series to the chart data being created. While this command defines general features of the series, the actual data needs to be defined through addDataPoint child commands. The series' order within the chart is the order in which they are added, either with this command or deriveSeries.
Parent commands
-
setChartData
Required. Defines the chart data for which the series is for.
Child commands
-
addDataPoint
Required. At least one of these child commands is required, as a series cannot exist without data.
Attributes
|
label |
|
|
|---|---|---|
|
Required |
Value type |
EL-evaluated |
|
No |
String |
Yes |
|
Defines the label for the series. This label may be displayed on the chart to help identify the series. |
||
|
color |
|
|
|---|---|---|
|
Required |
Value type |
EL-evaluated |
|
No |
String |
Yes |
|
Defines a color for the series. Data of this series on the chart will be displayed in this color, unless the data points have their own defined colors. The resolved value is expected to specify a color in hexadecimal, RGB, or HSL notation. If not defined, the command rendering the chart will select the color to display this series in. |
||
|
type |
|
|
|---|---|---|
|
Required |
Value type |
EL-evaluated |
|
No |
String |
Yes |
|
This attribute may be used to set this series to displayed as a chart of a type different to the main type of this chart. The resolved value is expected to be one of the following chart type Strings:
If not defined, this series is displayed according to the main type of the chart. |
||
|
xAxisID |
|
|
|---|---|---|
|
Required |
Value type |
EL-evaluated |
|
No |
String |
Yes |
|
Defines the X-axis the data points of this series map to. The resolved value is expected to match with the This attribute may be left undefined if the chart contains only one X-axis. |
||
|
yAxisID |
|
|
|---|---|---|
|
Required |
Value type |
EL-evaluated |
|
No |
String |
Yes |
|
Defines the Y-axis the data points of this series map to. The resolved value is expected to match with the This attribute may be left undefined if the chart contains only one Y-axis. |
||
Examples
The type, xAxisID and yAxisID can come useful with more varied charts that contain multiple series. A chart could have two series displayed in different types, and these series might require different value scales and so are given different Y-axes. The following specifies a mixed chart with one of the series represented as a line and other as bars, and with differing Y-axes.
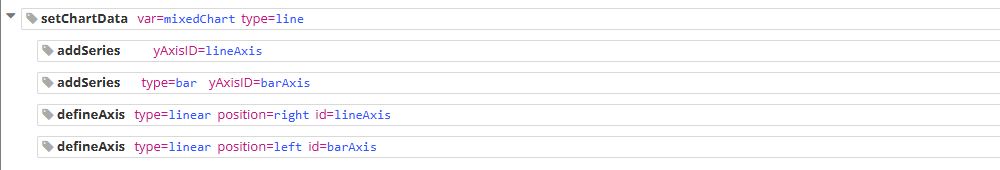
<setChartData var="mixedChart" type="line">
  <addSeries yAxisID="lineAxis">
    ...
  <addSeries type="bar" yAxisID="barAxis">
    ...
  <defineAxis type="linear" position="right" id="lineAxis">
  <defineAxis type="linear" position="left" id="barAxis">