The Chart functionality requires additional licenses. Please contact support@documill.com to enable the licenses.
A logic command that creates a variable holding a Chart data value, which may be given to certain content commands to draw a chart. Certain features of the chart are defined through this command itself, but the majority of the data is defined through various child commands. Notably, either an addSeries or a deriveSeries child command is required to add at least one data series to the chart.
Child commands
-
addSeries and deriveSeries
Required. Either of these two commands are used to add data series for the chart. A chart requires at least one data series, therefore at least one of these child commands is required. -
defineAxis
Optional. Defines an axis for the chart. Up to four of these child commands may be added, one for each of the four sides of the chart.
Attributes
|
var |
|
|
|---|---|---|
|
Required |
Value type |
EL-evaluated |
|
Yes |
String |
No |
|
Defines the name of the variable that will hold the Chart data value. |
||
|
type |
|
|
|---|---|---|
|
Required |
Value type |
EL-evaluated |
|
Yes |
String |
Yes |
|
Defines the type of the chart. The resolved value is expected to be one of the following chart type Strings:
|
||
Examples
If you have a Collection of data you'd like to get onto a chart, doing so can be fairly simple. Here's the most minimalistic approach using deriveSeries to create the data series:

<setChartData var="chart" type="line">
  <deriveSeries value="${quarterlySales}" label="Sales by Quarter" valueExpr="${item.value}" labelExpr="${item.quarter}">
Here's the same done with addSeries. This approach requires more commands, but allows use of logic control commands to direct the creation of data points:
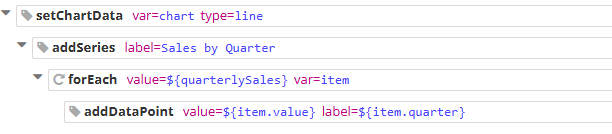
<setChartData var="chart" type="line">
  <addSeries label="Sales by Quarter" >
    <forEach value="${quarterlySales}" var="item">
      <addDataPoint value="${item.value}" label="${item.quarter}">
If creating a chart of a type with axes, the defineAxis command can be used to specify some details of them, such as the value range of the value-displaying axis:
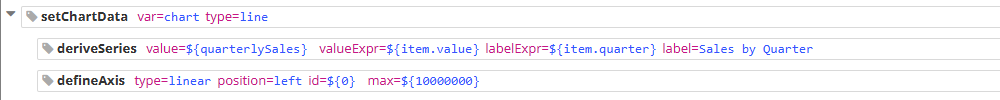
<setChartData var="chart" type="line">
  <deriveSeries value="${quarterlySales}" label="Sales by Quarter" valueExpr="${item.value}" labelExpr="${item.quarter}">
  <defineAxis type="linear" position="left" min="${0}" max="${10000000}">
Use of defineAxis is not absolutely necessary, as the chart-drawing commands will use default axes in case axis definitions are not present.